Data & Intelligence

Analytics & Reporting
Full Transparency Into Every Activity

Know exactly what's working. Real-time dashboards and comprehensive weekly reports give you complete visibility into productivity, meetings booked, and ROI.

Analytics and Reporting
The Challenge

You Need Full Visibility Into Your Outbound

Without real data, you can't optimize. You can't tell if your SDRs are productive, which messages resonate, or what your real ROI is.

Data Silos

Emails in one place, LinkedIn in another, phone calls scattered. No unified view of campaign performance.

Delayed Reporting

Weekly or monthly reports mean you can't respond quickly to what's not working. Missed opportunities.

Guessing On ROI

Hard to connect outreach activity to pipeline. You can't prove the value or optimize spend.

Real-Time Dashboard

See Everything At a Glance

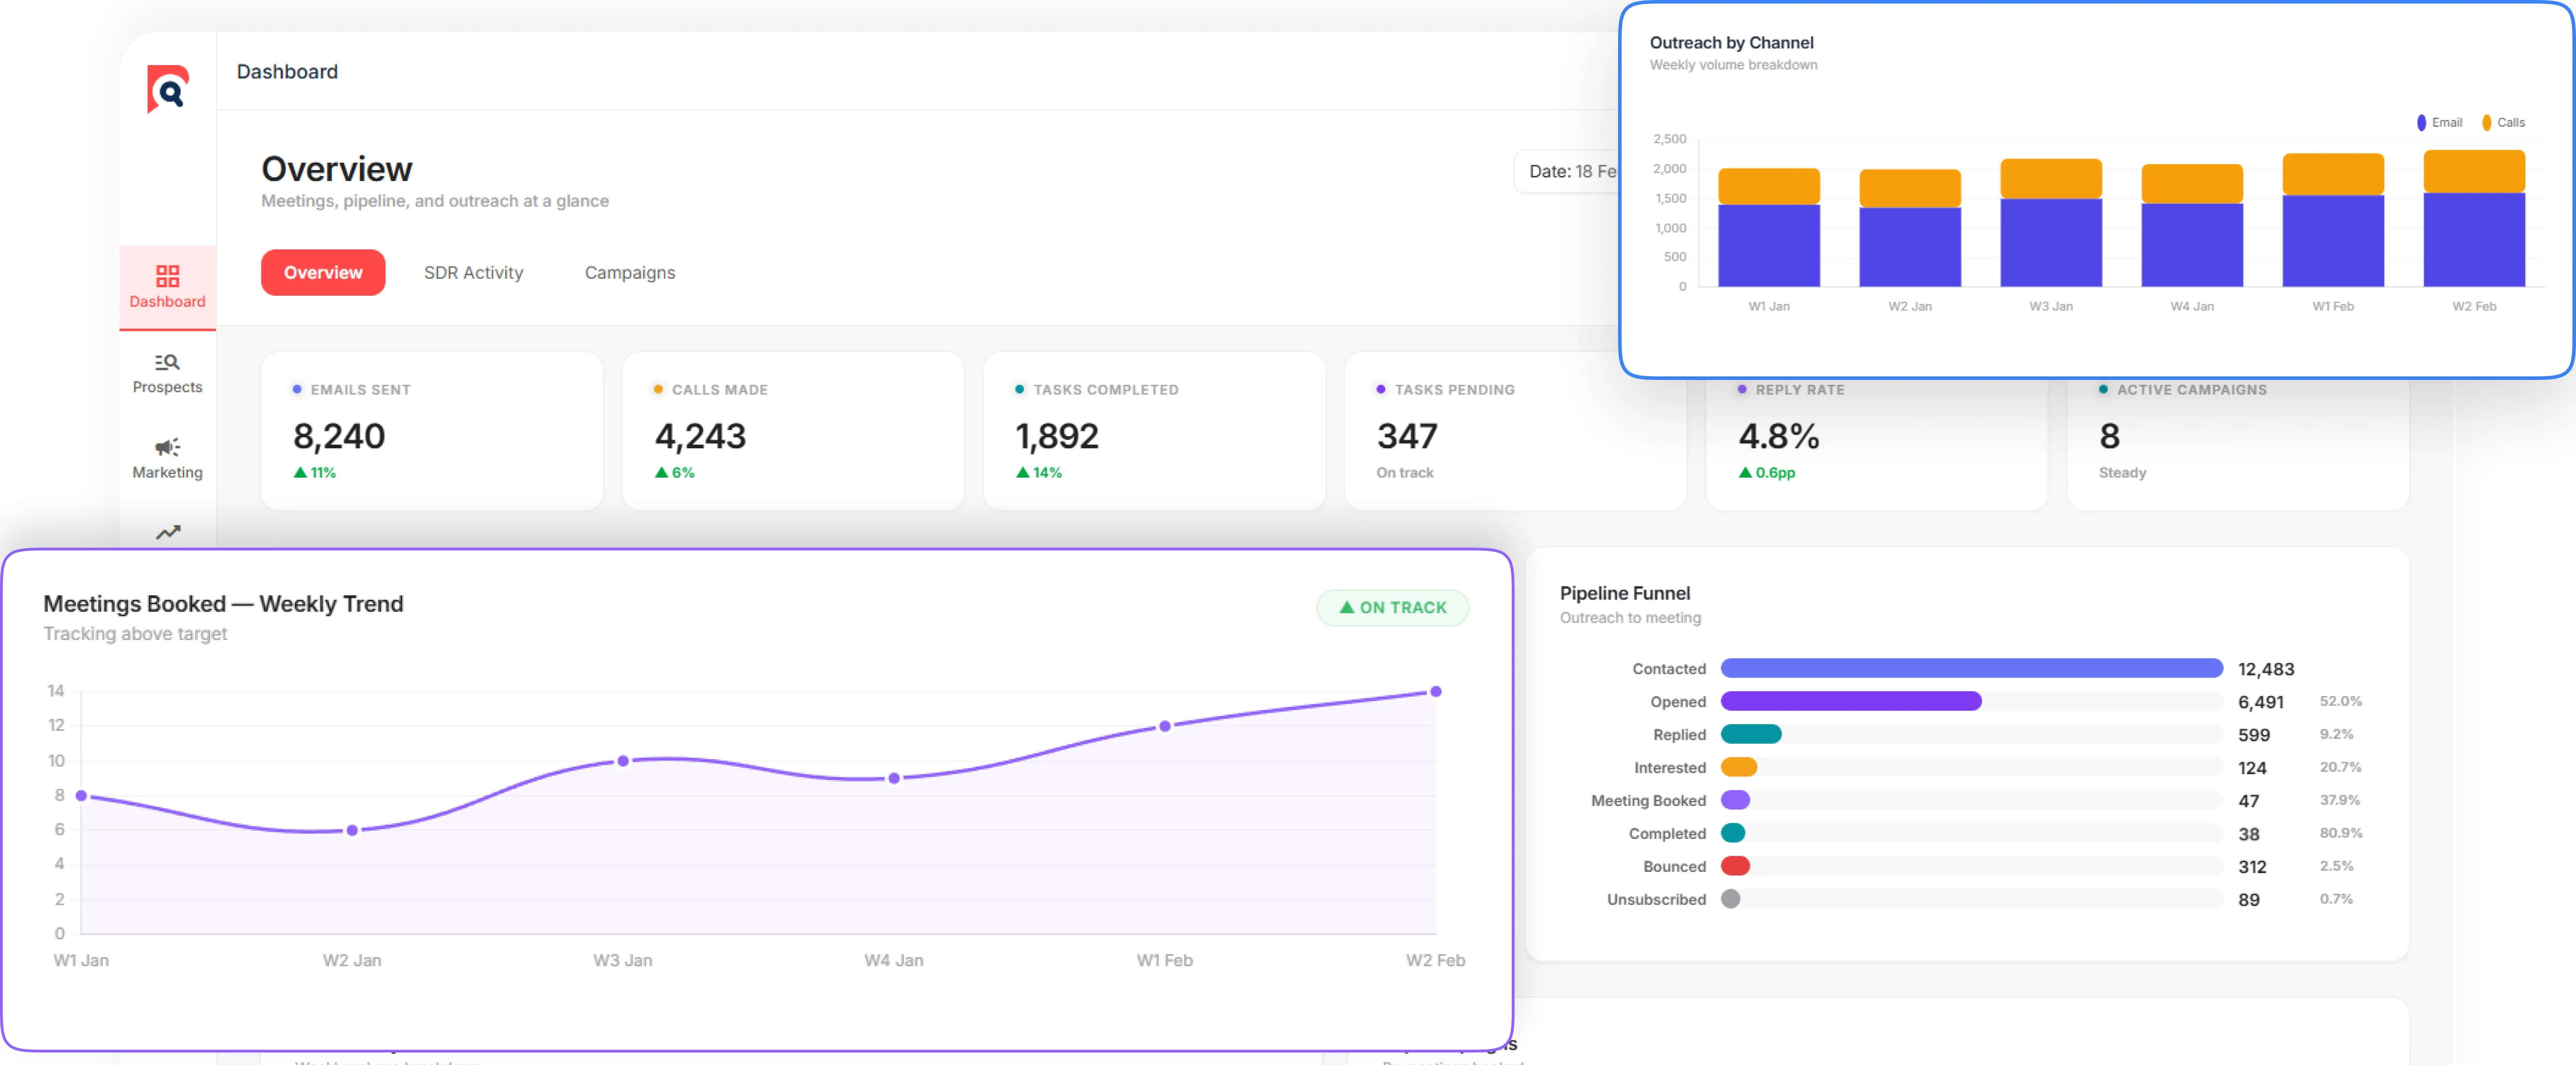
Our comprehensive dashboard gives you instant visibility into all outbound activity and results.

Productivity Metrics

  • Emails Sent 347
  • LinkedIn Connections 128
  • Phone Calls 42
  • Total Touchpoints 517
  • Accounts Targeted 89

Engagement Metrics

  • Email Opens 89 (25.6%)
  • Email Clicks 34 (9.8%)
  • Email Replies 18 (5.2%)
  • LinkedIn Acceptance Rate 67%
  • Conversations Started 28

Meeting Metrics

  • Meetings Booked 14
  • Show Rate 12/14 (85.7%)
  • Avg Meeting Duration 28 min
  • Pipeline Created $847K
  • Cost Per Meeting $412

ROI & Performance

  • Total Invested $5,768
  • Pipeline Value $847,000
  • Pipeline ROI 14,686%
  • Cost Per Lead $11.17
  • MoM Growth +23%
Weekly Reports

Comprehensive Weekly Briefings

Every week, get a detailed report with key metrics, insights, and recommendations for optimization.

Performance Summary

High-level view of the week's results with key metrics and trends.

  • • Week-over-week comparisons
  • • Top performing campaigns
  • • Underperforming areas flagged
  • • Trend analysis and insights
  • • Projections for the month

Action Items

Specific recommendations for optimization and next week's priorities.

  • • Messaging adjustments (if needed)
  • • Targeting refinements
  • • Channel recommendations
  • • Prospect list updates
  • • Budget allocation suggestions

Activity Breakdown

Detailed view of all activities and engagement across channels.

  • • Emails sent and performance
  • • LinkedIn activity and engagement
  • • Phone calls and conversations
  • • Response rate analysis
  • • Prospect engagement timeline

Pipeline Report

Full transparency on meetings booked and pipeline created.

  • • Meetings booked this week
  • • Total pipeline value created
  • • Cost per meeting analysis
  • • Forecast and projections
  • • ROI calculation
Dashboard Features

Complete Visibility Into Your Campaign

Real-Time Updates

Metrics update in real-time as activities happen. No waiting for data to sync or refresh.

Custom Reports

Build custom reports with the metrics that matter most to your business. Export as PDF or CSV.

Detailed Activity Logs

View every email sent, LinkedIn interaction, and phone call with full context and outcome tracking.

Trend Analysis

Identify patterns and trends over time. See what's working and what needs adjustment.

Historical Comparison

Compare current performance against previous weeks and months to track progress and improvements.

Team Performance

If you have multiple SDRs, see individual and team performance metrics. Identify top performers.

ROI Transparency

Know Your Exact Return On Investment

Connect outreach activity to pipeline created and deals closed. Understand your true ROI.

Campaign ROI

Total Investment: $5,768
Pipeline Created: $847,000
ROI: 14,686%

Cost per meeting: $412 | Cost per lead: $11.17

Pipeline Breakdown

Meetings Booked: 14
Qualified Opportunities: 9
Average Deal Size: $94K
Win Rate (Est): 35%

Get Complete Visibility Into Your Outbound

Know exactly what's working, where to optimize, and what your real ROI is. Book a demo to see our analytics dashboard.